Data Analysis
How have we analysed the data?
We started the analysis of the data with a fairly simple question: if you know a few key things about a home in Paris, could you make a good estimate of its DPE label, from A to G? That was the starting point of the model. Rather than trying to build something overly complex from the beginning, we wanted a tool that was understandable, practical, and useful within the wider project.
So the first step was to choose a clear scope. We focused only on Paris, and only on data from 2018 to 2021. This helped us keep the project manageable and made sure we were comparing observations that were reasonably consistent. We used open DPE data from ADEME, while the broader project also connected this work to Enedis electricity consumption data. For this specific model, though, the goal was more focused: predict the DPE label itself.
A key part of the project was cleaning the data. Open datasets are valuable, but they are not immediately ready to use, so before building the model we had to make the data coherent, readable, and comparable. This meant checking the raw DPE records, dealing with missing values, fixing inconsistent categories, and reformatting certain fields so the model could interpret them properly. A large part of the work was therefore not the model itself, but preparing a stable base for it to learn from. We also had to harmonize the data across 2018–2021, especially because the DPE methodology changed in 2021 and the information came from different ADEME datasets.
From there we had to decide what kind of information the model should "look at". We deliberately kept it light. Instead of feeding it dozens of variables, we selected a small number of characteristics that say a lot about a flat: its size, its energy-related indicators, the type of building, the construction period, and the main heating energy. The idea was not to create a black box, but something that stayed readable and made intuitive sense.
Then came the preparation work, which is less glamorous but absolutely necessary. Real-world data is never perfectly clean, so we had to organise it, standardise it, and make sure the model could read it properly. Once that foundation was in place, we split the data into one part for learning and one part for testing, so that we could check whether the model was actually generalising rather than just memorising.
For the model itself, we chose something relatively simple and interpretable. That choice was intentional. We did not want the most complicated algorithm possible; we wanted a model that performed well while remaining understandable enough to explain in the context of the project. In the end, it reached an overall accuracy of around 73%, which showed that with only a limited number of inputs, it was already able to recover much of the logic behind DPE labels.
Of course, the model is not perfect. Some labels are much rarer than others, which makes them harder to predict reliably, and there are also methodological limits that we identified for future improvements. But as a first building block, it gave us exactly what we needed: a solid, lightweight predictive tool that can support consistency checks and fit into the larger "Reality-Adjusted DPE" idea.
Beyond prediction, data quality
What became clear while building the model is that the real issue was not only prediction, but data quality. As we worked with the DPE datasets, we realised that too much information was missing, inconsistent, or simply not recorded in a usable way to properly judge how accurate the DPE labelling system really is. So the project gradually shifted: instead of only trying to reproduce the label, we also began identifying the gaps that prevent a more reliable assessment.
That is where our program comes in. The idea is not just to estimate a result, but to collect and structure the information that is currently missing. Each time a user goes through the program, new details about the dwelling can be recorded in a more consistent way. At a small scale, this already creates a more complete picture than the public data alone. At a larger scale, it could build the basis for a much more accurate analysis of whether DPE labels truly reflect the reality of a home's energy performance.
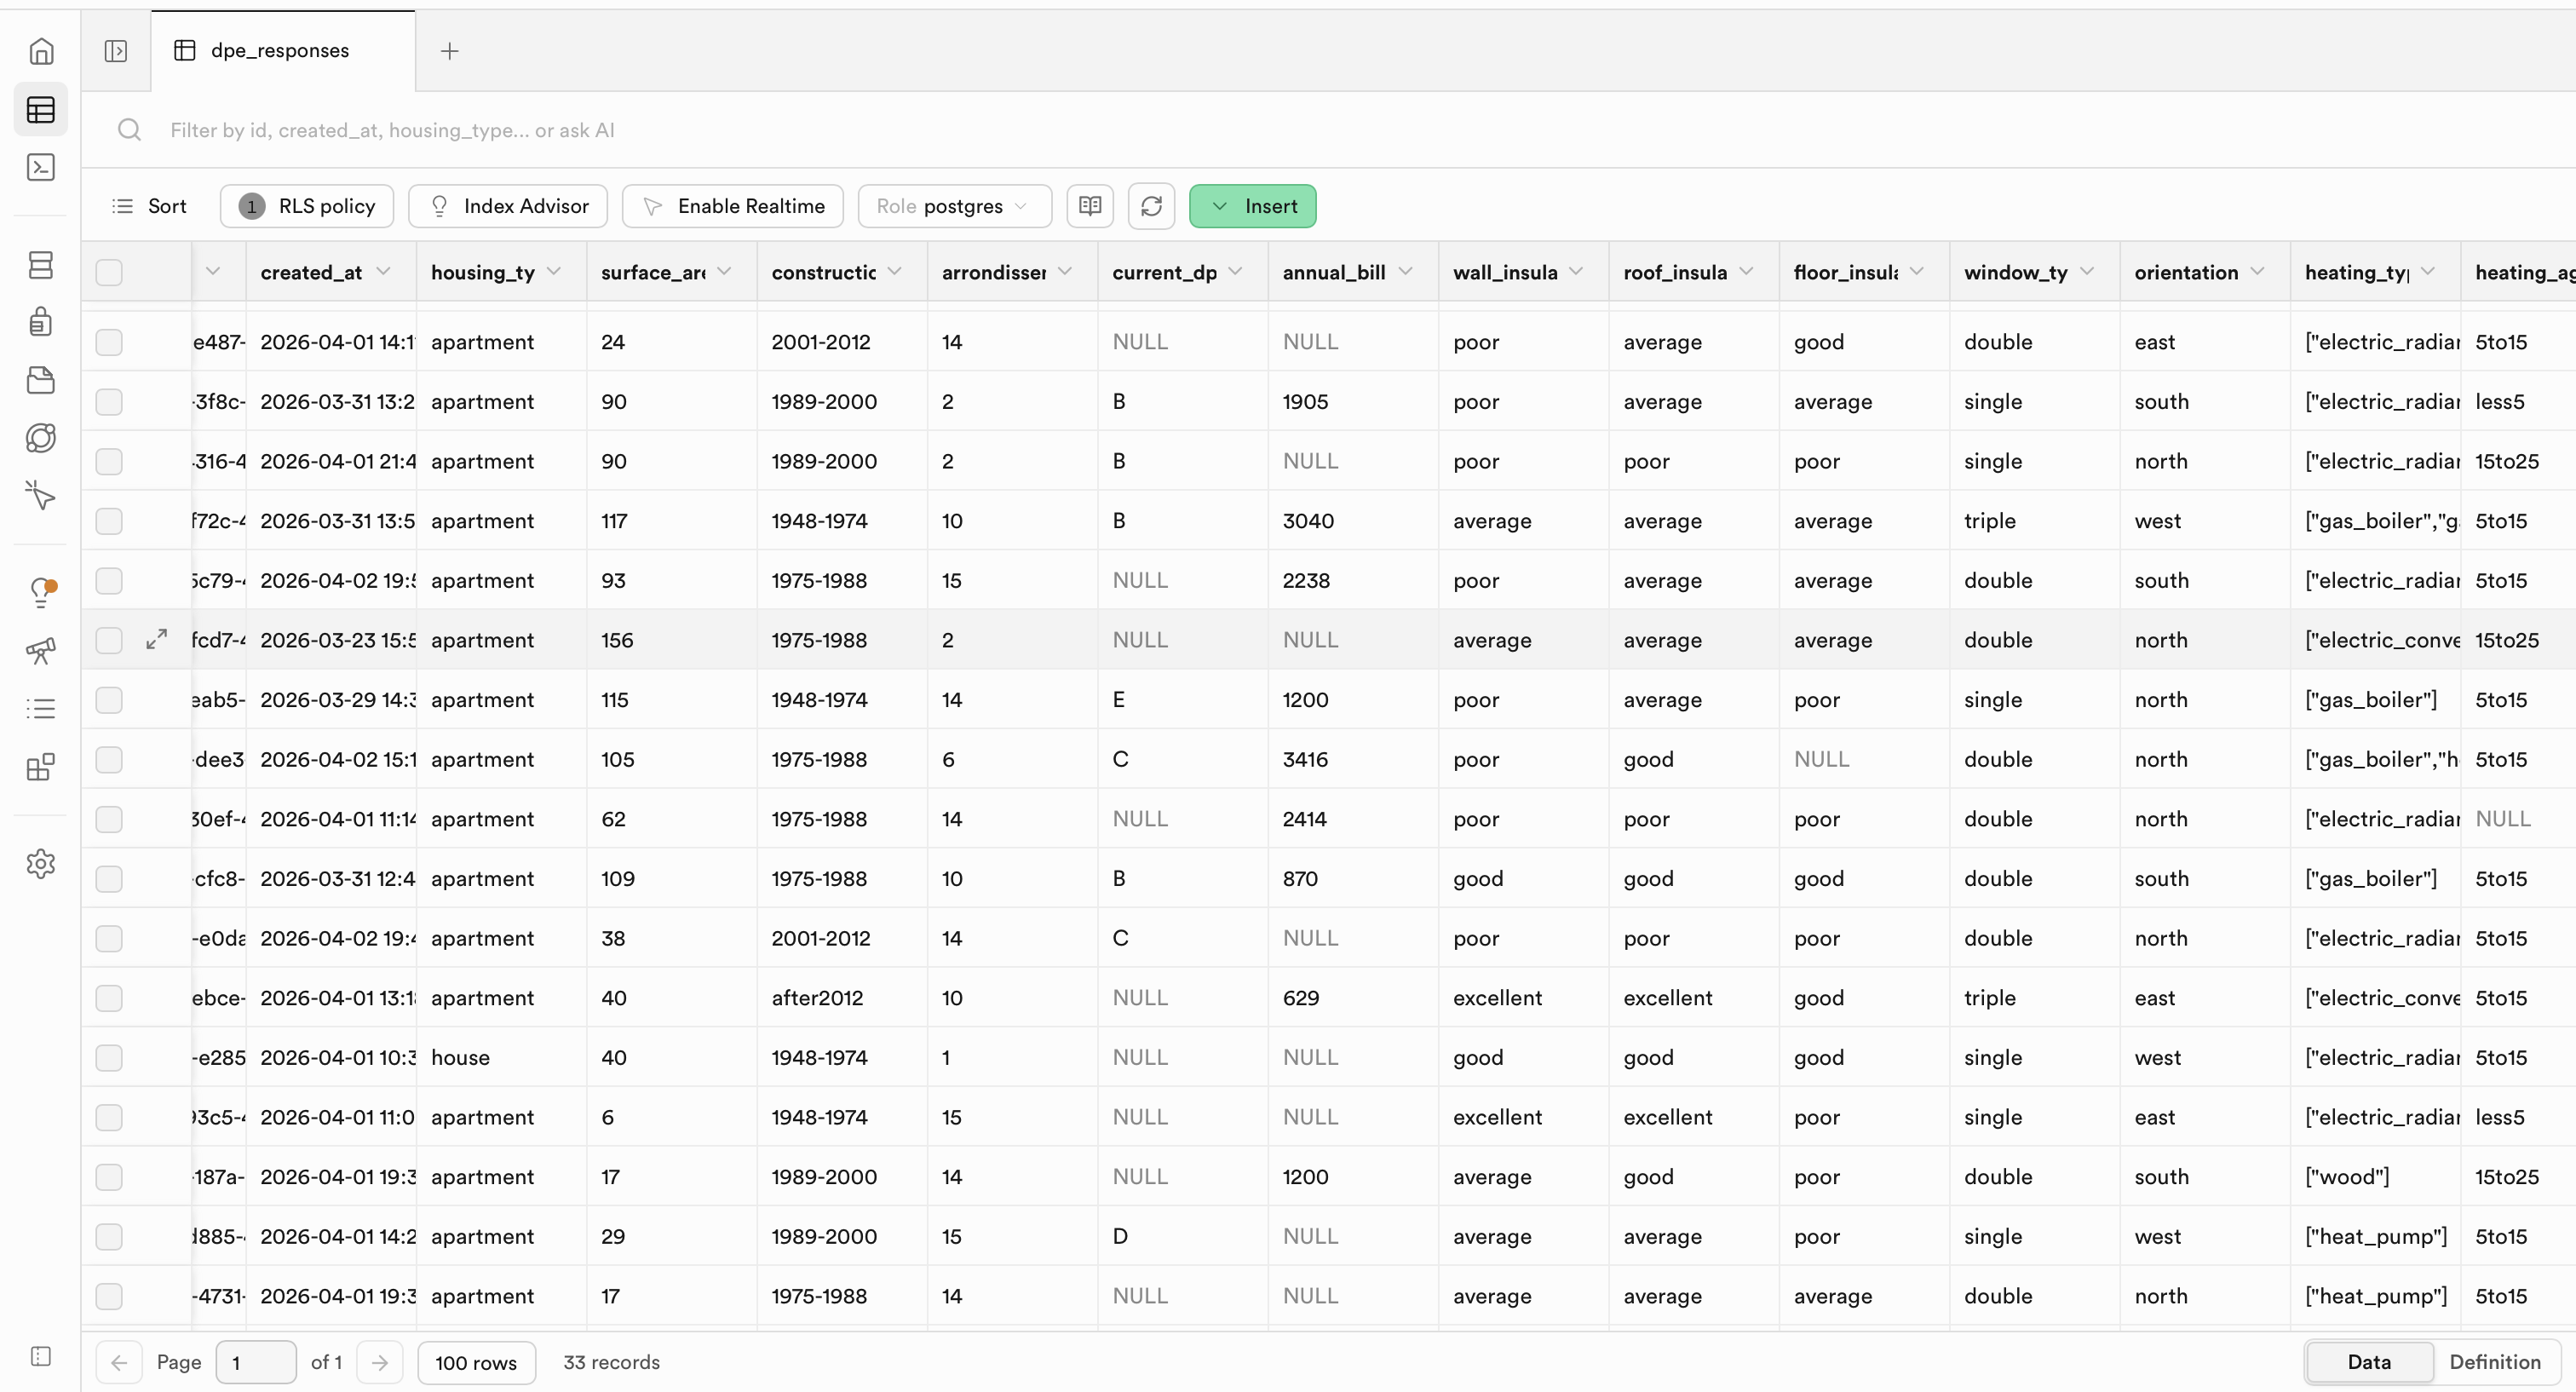
The Supabase infrastructure
To support that, we designed a simple Supabase structure as the backbone of the application. Supabase acts as the place where all the information is stored in a clean and organised way. In practice, it separates the data into a few logical blocks: one part for the property itself, one part for the answers or characteristics entered by the user, and one part for the results generated by the model. This makes it possible to keep track not only of a final prediction, but also of the underlying information that led to it.
This structure is important because it turns the project from a one-time calculator into a learning system. Instead of losing the information after each use, the database keeps it, which means that over time we can compare homes, detect recurring missing variables, and progressively improve the analysis. In other words, the value of the program increases with scale: the more it is used, the more robust the dataset becomes, and the more credible any future conclusions about the DPE system will be.
So in the end, the model is only one part of the story. The broader contribution of the project is that it creates the infrastructure to gather better data, store it properly, and make future analysis more reliable than what is currently possible from open datasets alone.
Full data analysis report
Everything is detailed more fully in the data analysis report below.